Standard Deviation as a measure of risk

Standard deviation is the most commonly used measure of risk. It measures how widely the actual
return of an investment varies around its expected return. The greater the fluctuation from the
expected returns the higher the standard deviation and therefore the higher the level of risk.
Standard deviation is an acceptable measure of risk if the distribution of returns forms a normal
distribution. The return on an investment can be expected to fall within one standard deviation of
the average return 68% of the time and within 2 standard deviations of the average return 95% of
the time.
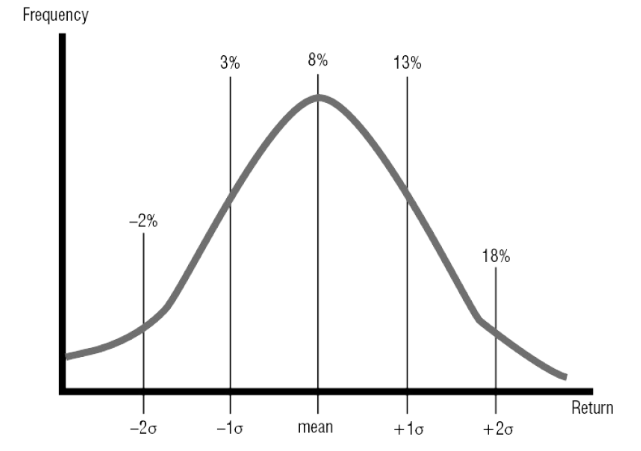
For example – if the mean (average return) is 8% and the standard deviation is 5%:
- 68% of returns will fall between 3% and 13%.
- 95% of returns will fall between -2% and 18%
This is shown on the normal distribution graph below. It can be useful when answer standard
deviation questions to draw a normal distribution graph.
Questions - Use Your Note Taker To Jot Down Ideas / Calculations
The returns from an investment have achieved an average return of 5%. If the investment has a
standard deviation of 5%, approximately what percentage of returns is expected to be POSITIVE?
a) 95%.
b) 84%.
c) 68%.
d) 16%.
B)
For this question it is best to draw the normal distribution graph to visualise the answer, see below.
As the mean is 5 and the standard deviation is 5 if the returns are one standard deviation lower than
the mean they will be 0%. Returns will fall within one standard deviation of the mean 68% of the
time. Therefore, to find what percentage of returns will fall outside of one standard deviation you
take 68% from 100% to give you 32%. However, we only want to find out what percentage of returns
fall below 1 standard deviation below the mean so we divide this by 2 to get 16% of returns. These
are the negative returns – below 0% return. To find the positive returns we take the 16% from 100%
to get 84% of returns being positive.

- Further Study Text: Pages 133 - 136